


National herbicide resistance survey data


National random weed surveys and herbicide screening are conducted every four years in Australian grain regions.
Herbicide resistance testing is a critical tactic within the ‘mix-and-rotate’ pillar of the WeedSmart Big 6 integrated weed management program to minimise the risk of herbicide resistance. Knowing which herbicide modes of action are effective on the weeds present in a field means making more informed decisions for future herbicide programs.
There are two types of weed collection for herbicide resistance testing:
- Random weed surveys – Random weed surveys involve entering fields at random and collecting seed samples from the weeds present. These seeds are sown, and the seedlings are grown and assessed in pot trials during the normal growing season, according to the species. The trials are typically conducted outdoors under natural growing conditions. Herbicides are applied in a spray cabinet, with survival assessed. Data from the random weed surveys shows the extent of herbicide resistance in a range of weed species to a regional level. This information is valuable to weed researchers and agronomists to direct agronomic and product use pattern research to support sustainable use of herbicide modes of action.
- Suspect weed collection – Commercial testing of ‘suspect’ weed samples collected by farmers and agronomists provides herbicide resistance and susceptibility results that they can use to make immediate and future herbicide application decisions.
This page is dedicated to findings from random weed surveys in Australia.
You can find out about commercial ‘suspect’ weed collection and testing here : https://www.weedsmart.org.au/content/testing-for-herbicide-susceptibility-and-resistance/
Herbicide resistance survey history in Australia
The first cases of herbicide resistance in Australia were confirmed in 1982 in populations of annual ryegrass (Lolium rigidum Gaud.) (see Table 9).
A population of annual ryegrass from Western Australia was resistant to multiple active ingredients – chlorsulfuron, diclofop-methyl, fluazifop-butyl, sethoxydim, tralkoxydim, and trifluralin – from three mode-of-action groups (Groups 1, 2 and 3).
In South Australia, another population of annual ryegrass was also resistant to multiple active ingredients – chlorpropham, chlorsulfuron, clomazone, diclofop-methyl, ethalfluralin, fluazifop-butyl, imazapyr, metolachlor, metsulfuron-methyl, quizalofop-ethyl, sethoxydim, tralkoxydim, tri-allate, triasulfuron, and trifluralin – from six mode-of-action groups (Groups 1, 2, 3, 13, 15 and 23).
Charles Sturt University conducted a random survey in 1991 to determine the level of resistance in annual ryegrass to selective herbicides across the south-west slopes region of New South Wales. The researchers found that 30 per cent of samples were resistant to at least one herbicide. A subsequent survey of commercially available ryegrass seed found that 58 per cent of samples were resistant to at least one herbicide.
This finding prompted the establishment of Australia’s first commercial herbicide resistance testing service at Charles Sturt University (CSU). Since then, CSU, Plant Science Consulting (based at the Waite Campus in Adelaide) and the Australian Herbicide Resistance Initiative (at the University of Western Australia) have been testing weed samples from farmers and agronomists, in tandem with randomised national weed surveys.
GRDC-funded random weed surveys have been conducted in WA, SA, Vic, Tas and NSW from the early 2000s. Researchers collected the main weed species, including ryegrass, wild radish, wild oats, and sowthistle. Each research organisation followed its own weed collection and herbicide resistance testing protocols, which made it difficult to compare the findings and to build a national view of the extent and distribution of herbicide-resistant weed populations.
National surveys in broadacre cropping systems
The 2020 national survey was the first to be fully coordinated across Australia with standardised weed collection and herbicide resistance testing protocols, conducted by research teams from Charles Sturt University, University of Adelaide, University of Western Australia, University of Sydney and Queensland Department of Primary Industries. The Grains Research and Development Corporation (GRDC) invests in these national surveys every four years.
In 2020, research teams led by John Broster (CSU), Michael Widderick (Qld DPI), Peter Boutsalis (Adelaide Uni) and Mechelle Owen (AHRI) collected over 3500 weed samples – ryegrass, wild oats, barley grass, brome grass, sowthistle, wild radish, cape weed and Indian hedge mustard – from 2588 paddocks across all cropping regions (see map). The national, state and regional herbicide resistance screening of weeds collected during the 2020 random survey of winter cropping paddocks is now complete.
In 2024, almost 4000 weed samples, this time also including annual phalaris, were collected from 2061 paddocks. Screening of these samples will continue through this year and 2027.
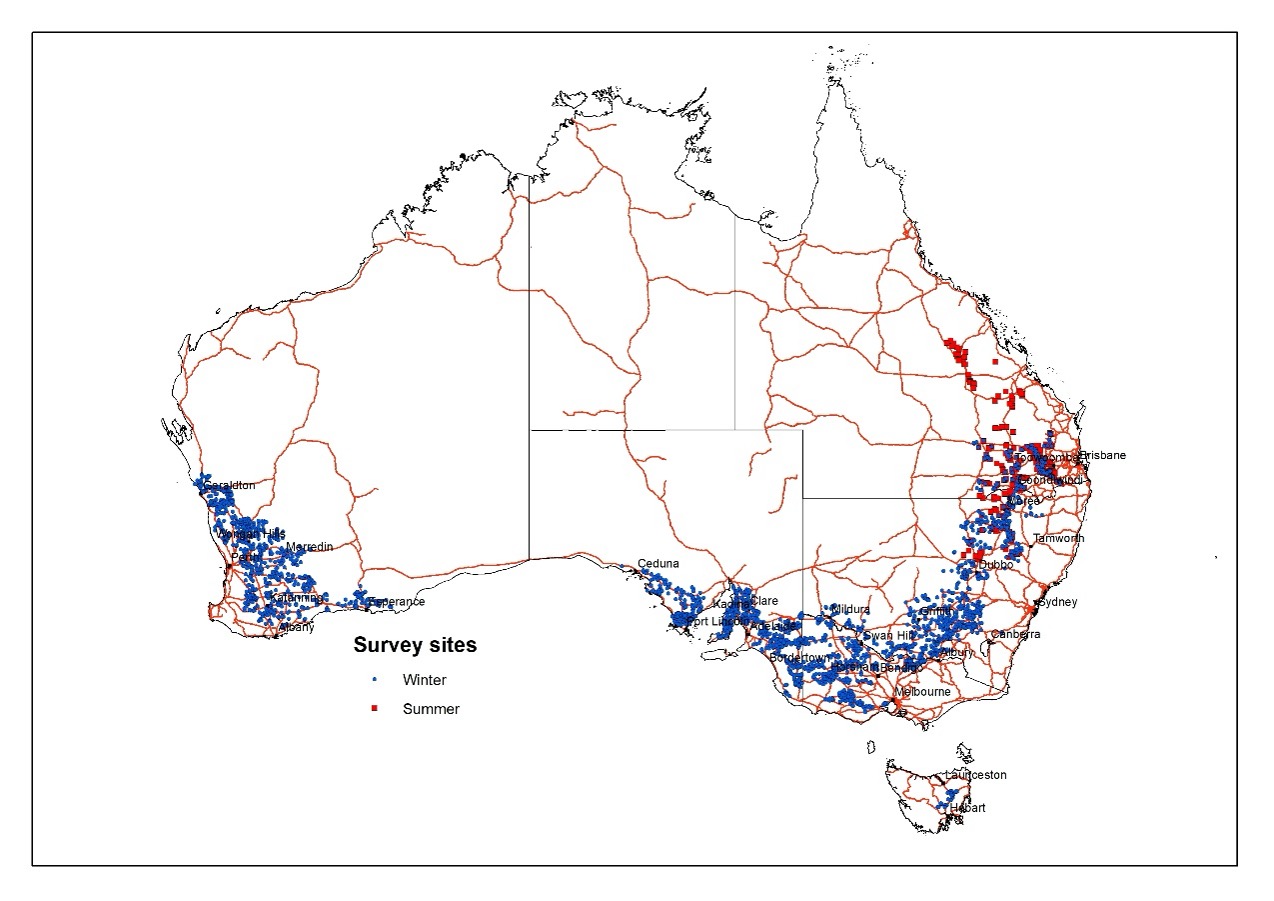
Sampling sites for the 2020 national herbicide resistance weed survey.
Weed density
Weed densities at the pre-harvest collection time in both 2020 and 2024 were very low or low, in fact well below one plant per square metre, for all species except ryegrass. The 2024 survey represents the first complete national data set for weed density. Around 21 per cent of fields where ryegrass was collected had weed densities over 10 plants/m2, and in one-third of these paddocks, ryegrass dominated the crop. This is very important for herbicide resistance risk management, where it really is a numbers game to keep weed numbers low by stopping weeds that escape herbicide control from setting seed.
Table 1: Weed density of major collected winter cropping weed species from the 2020* and 2024** national herbicide resistance survey and summer cropping weed species from the 2020-21^ summer crop survey (Qld and northern NSW)
| Weed density# | ||||||
| Species | Survey | V low | Low | Medium | High | V high |
| Ryegrass | 2020* | 28 | 46 | 18 | 5 | 3 |
| 2024** | 19 | 38 | 23 | 14 | 7 | |
| Wild oats | 2020* | 59 | 33 | 6 | 1 | 1 |
| 2024** | 43 | 38 | 14 | 4 | 1 | |
| Barley grass | 2020* | 56 | 32 | 9 | 2 | 1 |
| 2024** | 39 | 41 | 12 | 5 | 3 | |
| Brome grass | 2020* | 50 | 39 | 10 | 1 | 1 |
| 2024** | 44 | 42 | 10 | 4 | 1 | |
| Sowthistle | 2020* | 77 | 17 | 6 | 0 | 0 |
| 2024** | 50 | 32 | 11 | 6 | 1 | |
| Wild radish | 2020* | 63 | 32 | 3 | 1 | 1 |
| 2024** | 54 | 37 | 5 | 3 | 1 | |
| Feathertop Rhodes grass | 2020–21^ | 80 | 12 | 6 | 2 | 0 |
| Fleabane | 2020–21^ | 83 | 12 | 5 | 0 | 0 |
| Sowthistle | 2020–21^ | 84 | 11 | 5 | 0 | 0 |
| Barnyard grass | 2020–21^ | 74 | 11 | 13 | 3 | 0 |
| Windmill grass | 2020–21^ | 100 | 0 | 0 | 0 | 0 |
# V Low (<1 plant/10 m2); Low (<1 plant/m2); Medium (1–10 plants/m2); High (>10 plants/m2); V High (dominating crop)
* In 2020, 2588 winter cropping paddocks were surveyed nationally, however weed density data was not collected for the paddocks surveyed in Victoria and Tasmania and only in some of the paddocks surveyed in South Australia
** In 2024, 2061 winter cropping paddocks were surveyed nationally
^In 2020–21, 92 summer cropping paddocks were surveyed in northern NSW
Ryegrass resistance status across Australia
Glyphosate (Group 9) resistance in annual ryegrass has increased nationally from 4 per cent resistant in 2013-17 to 16 per cent in 2020. An additional 22 per cent of ryegrass populations were developing resistance to glyphosate in 2020 (Table 2).
Nationally, screening showed major increases in the extent of ryegrass resistance to post-emergent herbicides (Group 1 clethodim and pinoxaden; Group 2 SU and Imi) from 2013-17 to 2020. Previous surveys showed that over 80 per cent of ryegrass samples are resistant or developing resistance to Group 1 ‘fop’ herbicides, so samples from the 2020 survey were not screened for this herbicide sub-group. Only two ryegrass samples were resistant to paraquat (Group 22), with another six samples developing resistance nationally.
Resistance to pre-emergent herbicides is less common in ryegrass than for post-emergent herbicides, but the increasing trend in resistance to Group 15 (prosulfocarb + s-metolachlor) in ryegrass is concerning. Trifluralin (Group 3) resistance in ryegrass is most widespread but seems relatively stable. No ryegrass samples were resistant or developing resistance to bixlozone (Group 13), cinmethylin (Group 30) and propyzamide (Group 3).
Table 2: Resistance status of ryegrass populations from 2013 to 2020 herbicide resistance surveys in Australian cropping regions.
| Annual ryegrass populations classed resistant (%) and (developing resistance %)* |
||
| MOA group and chemical | Australia (2013-17) | Australia (2020) |
| Group 1 ‘fop’ | 65 (19) | NT |
| Group 1 clethodim | 7 (22) | 23 (25) |
| Group 1 pinoxaden | NT | 71 (18) |
| Group 2 ‘SU’ | 66 (18) | 91 (5) |
| Group 2 ‘Imi’ | 50 (31) | 79 (12) |
| Group 3 trifluralin | 16 (19) | 12 (16) |
| Group 15 (prosulfocarb + s-metolachlor) | <1 (5) | 2 (18) |
| Group 15 (pyroxasulfone) | <1 (3) | 0 (1) |
| Group 9 glyphosate | 4 (15) | 16 (22) |
| Number of samples | 1840 | 1486 |
* Numbers in brackets indicate % of populations developing resistance (0.1 – 19.9% survival). Numbers outside brackets are % resistant (>20% survival) NT indicates herbicide group not tested
Wild oats, brome grass, barley grass resistance status across Australia
Nationally, resistance in wild oats has remained stable (Table 3). Resistance to ‘fop’ herbicides is the most widespread, with 16 per cent of samples resistant and 15 per cent developing resistance in 2020. Resistance is developing in wild oats to flamprop, tri-allate (Group 15) and pinoxaden (Group 1).
Of the 382 brome grass samples collected, screening showed that if a population had resistance to sulfosulfuron (Group 2), it was highly likely to be resistant to another Group 2 herbicide, pyroxsulam (Table 4). Almost 30 per cent of populations were resistant to sulfosulfuron, and a further 10 per cent were developing resistance. Pyroxsulam resistance was found in 37 per cent of brome grass samples, with a further 16 per cent developing resistance. Resistance to the other herbicides was much lower (less than 5%), and glyphosate resistance was detected in two brome grass populations.
Barley grass populations across Australia were mostly susceptible to all herbicides (less than 5% resistance), and all populations were susceptible to glyphosate (Table 5). Resistance to sulfosulfuron was 4 per cent (and 3% developing resistance) nationally, with resistance levels in Western Australian samples notably higher than the national average (6% resistant and 10% developing resistance). Resistance to Group 1 quizalofop (2% resistant and 3% developing resistance) and paraquat (1% resistant and 1% developing resistance) was detected in barley grass.
Pre-emergent herbicides, fops/dims and imidazoline herbicides, as well as the knockdown herbicides, provide good control of most brome and barley grass populations.
Table 3: Resistance status of wild oats populations from 2013 to 2020 herbicide resistance surveys in Australian cropping regions.
| Wild oats populations classed resistant (%) and (developing resistance %)* |
||
| MOA group and chemical | Australia (2013-17) | Australia (2020) |
| Group 1 ‘fop’ | 23 (16) | 16 (15) |
| Group 1 clethodim | 0 (3)** | 0.3 (2) |
| Group 1 pinoxaden | NT | 5 (12) |
| Group 2 ‘SU’ | 5 (9) | 0.5 (8) |
| Group 15 tri-allate | 0 (2) | 0 (14) |
| Group 0 flamprop | NT | 7 (25) |
| Number of samples | 1006 | 681 |
* Numbers in brackets indicate % of populations developing resistance (0.1 – 19.9% survival). Numbers outside brackets are % resistant (>20% survival) NT indicates herbicide group not tested
Table 4: Resistance status of brome grass populations from 2020 to 2024 herbicide resistance surveys in Australian cropping regions.
| Brome grass populations classed resistant (%) and developing resistance (%)* |
||
| MOA group and chemical | Australia (2020) | Australia (2024) |
| Group 1 ‘fop’ | 2 (1) | 3 (1) |
| Group 1 clethodim | 2 (0) | 2 (2) |
| Group 2 ‘SU’ | 29 (10) | 23 (14) |
| Group 2 ‘IMI’ | 0 (1) | 1 (0) |
| Group 2 Crusader | 37 (16) | Not Tested |
| Group 9 glyphosate | 1 (0) | 0 (0) |
| Number of samples | 382 | 296 |
Table 5: Resistance status of barley grass populations in 2020 herbicide resistance surveys in Australian cropping regions.
| Barley grass populations classed resistant (%) and developing resistance (%)* |
||
| MOA group and chemical | Australia (2013-17) | Australia (2020) |
| Group 1 ‘fop’ | 2 | 2 (3) |
| Group 1 clethodim | 0.7 | 1 (0) |
| Group 2 ‘SU’ | 19 | 4 (3) |
| Group 2 ‘IMI’ | – | 1 (3) |
| Group 9 glyphosate | – | 0 (0) |
| Group 22 paraquat | 6 | 1 (1) |
| Number of samples | 262 | 251 |
Sowthistle resistance status across Australia
In sowthistle, over 70 per cent of populations sampled were resistant to chlorsulfuron (Group 2 ‘SU’) in 2020 (Table 6). While no samples from the 2020 survey were resistant to glyphosate, 5 per cent were developing resistance. Screening from the 2024 survey indicates a jump in both the percentage of glyphosate-resistant populations (4%) and the number developing resistance (15%).
Table 6: Resistance status of sowthistle populations from 2020 to 2024 herbicide resistance surveys in Australian cropping regions.
| Sowthistle populations classed resistant (%) and (developing resistance %)* |
||
| MOA group and chemical | Australia (2020) | Australia (2024) |
| Group 2 ‘SU’ | 73 (21) | 38 (32) |
| Group 2 ‘Imi’ | NT | 56 (22) |
| Group 4 ‘Auxin mimics’ | 3 (29) | 1.3 (15) |
| Group 9 glyphosate | 0 (5) | 4 (15) |
| Number of samples | 562 | 453 |
* Numbers in brackets indicate % of populations developing resistance (0.1 – 19.9% survival). Numbers outside brackets are % resistant (>20% survival), NT indicates herbicide group not tested
Indian hedge mustard and wild radish resistance status across Australia
Only 36 Indian hedge mustard samples were collected in the 2020 random survey – most from South Australia and a few from Victoria. More than half the samples (57%) were resistant to chlorsulfuron (Group 2), 40 per cent were resistant to imazamox + imazapyr (Group 2), and 20 per cent were resistant to diflufenican (Group 12). A small number of samples were resistant to atrazine and 2,4-D amine, but no resistance was detected to glyphosate.
Wild radish was found in all states in the 2020 survey (Table 7), however 94 of the 130 populations were collected in Western Australia. Nationally resistance to chlorsulfuron (71%), imazamox + imazapyr (47%) and 2,4-D (37%) herbicides was common, while all samples remained susceptible to glyphosate. In Western Australia, resistance to chlorsulfuron (86%), imazamox + imazapyr (55%) and 2,4-D (49%) was widespread, and resistance to diflufenican is 20 per cent, with another 54 per cent developing resistance. Developing resistance to pyrasulfotole + bromoxynil (2%), and resistance to atrazine (6%) was detected in WA.
The WA wild radish samples from the 2020 survey were also screened using a few commercial herbicide mixtures. Bromoxynil + pyrasulfotole (Velocity®) provided effective control of 98 per cent of wild radish populations, and bromoxynil + diflufenican (Jaguar®) also provide control in 88 per cent of populations. Other mixtures provided less control – MCPA + bromoxynil + diflufenican + picolinafen (Quadrant®) (79% control), MCPA + pyrasulfotole (Precept®) (71% control), picolinafen + bromoxynil + MCPA (Flight®) (64% control), while MCPA + diflufenican (Tigrex®) controlled only 31 per cent of populations.
Table 7: Resistance status of wild radish populations from 2020 to 2024 herbicide resistance surveys in Australian cropping regions.
| Wild radish populations classed resistant (%) and developing resistance (%)* | ||
| MOA group and chemical | Australia (2020) | Australia (2024) |
| Group 2 ‘SU’ | 71 (11) | 79 (4) |
| Group 2 IMI | 47 (20) | 39 (33) |
| Group 4 2,4-D | 37 (34) | 43 (18) |
| Group 12 diflufenican | 15 (46) | 28 (27) |
| Group 5 Atrazine | 3 (3) | 2 (7) |
| Group 6+27 bromoxynil + pyrasulfotole | 0 (1) | 3 (6) |
| Group 9 glyphosate | 0 (0) | 0 (0) |
| Number of samples | 130 | 127 |
Fleabane, barnyard grass, feathertop Rhodes grass and sweet summer grass resistance status in Queensland and northern NSW
An additional survey was conducted in northern NSW and Queensland as part of both the 2020 and 2024 surveys just prior to the harvest of the summer crops to determine the resistance status of summer weed species (Table 8).
Barnyard grass, feathertop Rhodes grass and sweet summer grass samples collected in 2020 showed glyphosate resistance in 50, 99 and 58 per cent, respectively.
Table 8: Resistance status of summer weed species from 2020 and 2024 herbicide resistance surveys.
| Summer weed populations classed resistant (%) | ||||||||
| Flaxleaf fleabane | Sweet summer grass | Awnless barnyard grass | Feathertop Rhodes grass | |||||
| Chemical | 2020 | 2024 | 2020 | 2024 | 2020 | 2024 | 2020 | 2024 |
| Group 9 glyphosate | 100 | 100* | 58 | 79 | 50 | 71* | 99 | 99* |
| Group 1 haloxyfop | NA | NA | 0 | 0* | 0 | 0 | 0 | 7* |
| Group 22 paraquat | NA | NA | NA | 0 | 0 | NA | 8 | testing |
| No. of samples | 80 | 136 | 16 | 29 | 108 | 124 | 137 | 165 |
* Populations with low germination and/or some survivors being retested if seed is available
Weeds of economic importance and their resistance profile
The GRDC publication ‘Impact of weeds on Australian grain and cotton production’ lists the ten in-crop weeds and ten fallow weeds causing the greatest revenue loss in broadacre grain cropping systems. Similarly, this report identified the top five weeds causing revenue loss in cotton cropping systems, both in-crop and in fallow.
Table 9 provides a link to the first confirmed case of herbicide resistance in Australia for each of these weeds. Click on the link to the International Herbicide Resistant Weeds website (www.weedscience.org) to view other confirmed cases globally for each weed.
Table 9: First confirmed case of herbicide resistance in Australia for each weed of major economic loss in broadacre grain and cotton production systems
| Top 5 weeds by area in cotton crops | Top 5 fallow weeds causing revenue loss in cotton crops |
| Flaxleaf fleabane (C. bonariensis) (first case 2010) Tall fleabane (C sumatrensis) (first case 2018) |
Heliotrope / potato weed (no confirmed HR cases) |
| Awnless barnyard grass (first case 2004) | Wild turnip (first case 1992) |
| Sowthistle (milkthistle) (first case 1990) | Windmill grass (first case 2010) |
| Feathertop Rhodes grass (first case 2015) | Wild oats (A. fatua) (first case 1985) Wild oats (A. sterilis) (first case 1989)Wild oats (A. sterilis ssp ludoviciana) (first case 2002) |
| Sesbania (no confirmed HR cases) | Sowthistle (milkthistle) (first case 1990) |
Resources
GRDC investment page with project Update papers, articles and podcasts GRDC Code: UCS2008-001RTX
AHRI herbicide resistance survey results up to 2020
WeedSmart video: Weed surveys track herbicide resistance with Mechelle Owen AHRI
WeedSmart Shorts video with Chris Preston: Multiple herbicide-resistant hot-spots revealed in the most recent south-eastern Australian survey on ryegrass
Journal paper: A quarter of a century of monitoring herbicide resistance in Lolium rigidum in Australia. Crop and Pasture Science 70(3), 283-293. doi:https://doi.org/10.1071/CP18584
WeedSmart article: Extent of herbicide resistance in summer weeds revealed
WeedSmart article: Surveys highlight the cross-resistance to herbicides
WeedSmart article: Are we gaining ground against herbicide-resistant weeds
